Industries
Canopy change that 10 m pixels miss
Forestry and land-use teams see logging tracks, thinned stands and regrowth separate from intact canopy — GammaEarth turns free Sentinel-2 imagery from 10 m into 1 m detail across all 10 spectral bands. Every forest on Earth is re-imaged every five days, and the archive reaches back to 2018.
See the difference
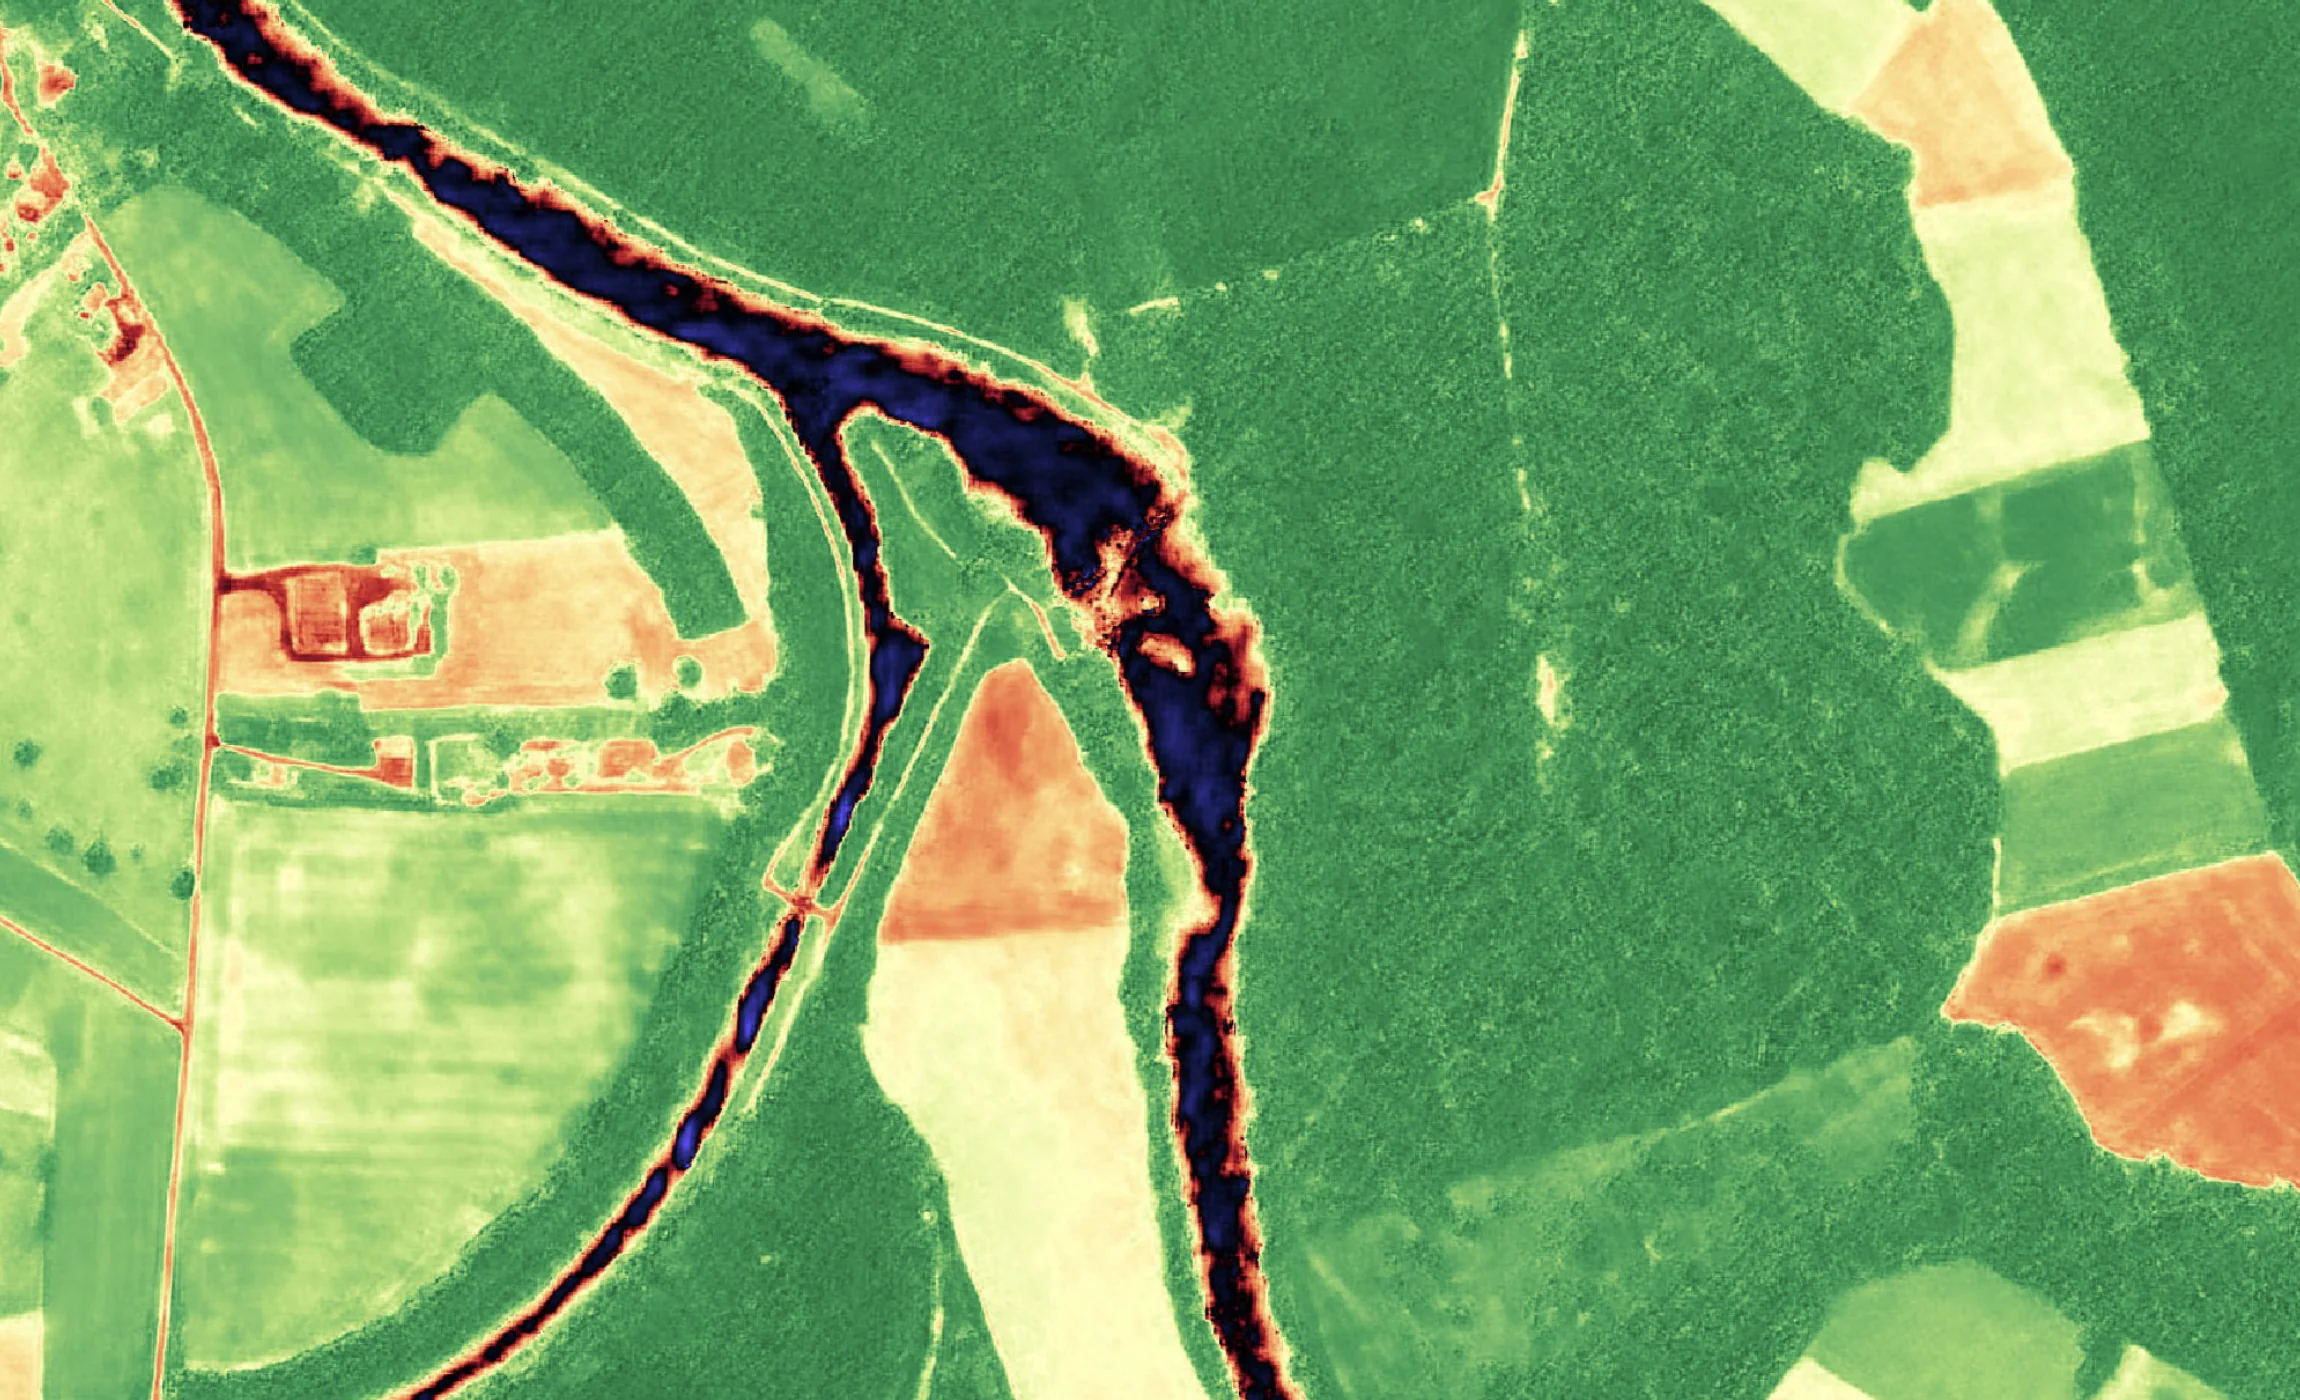
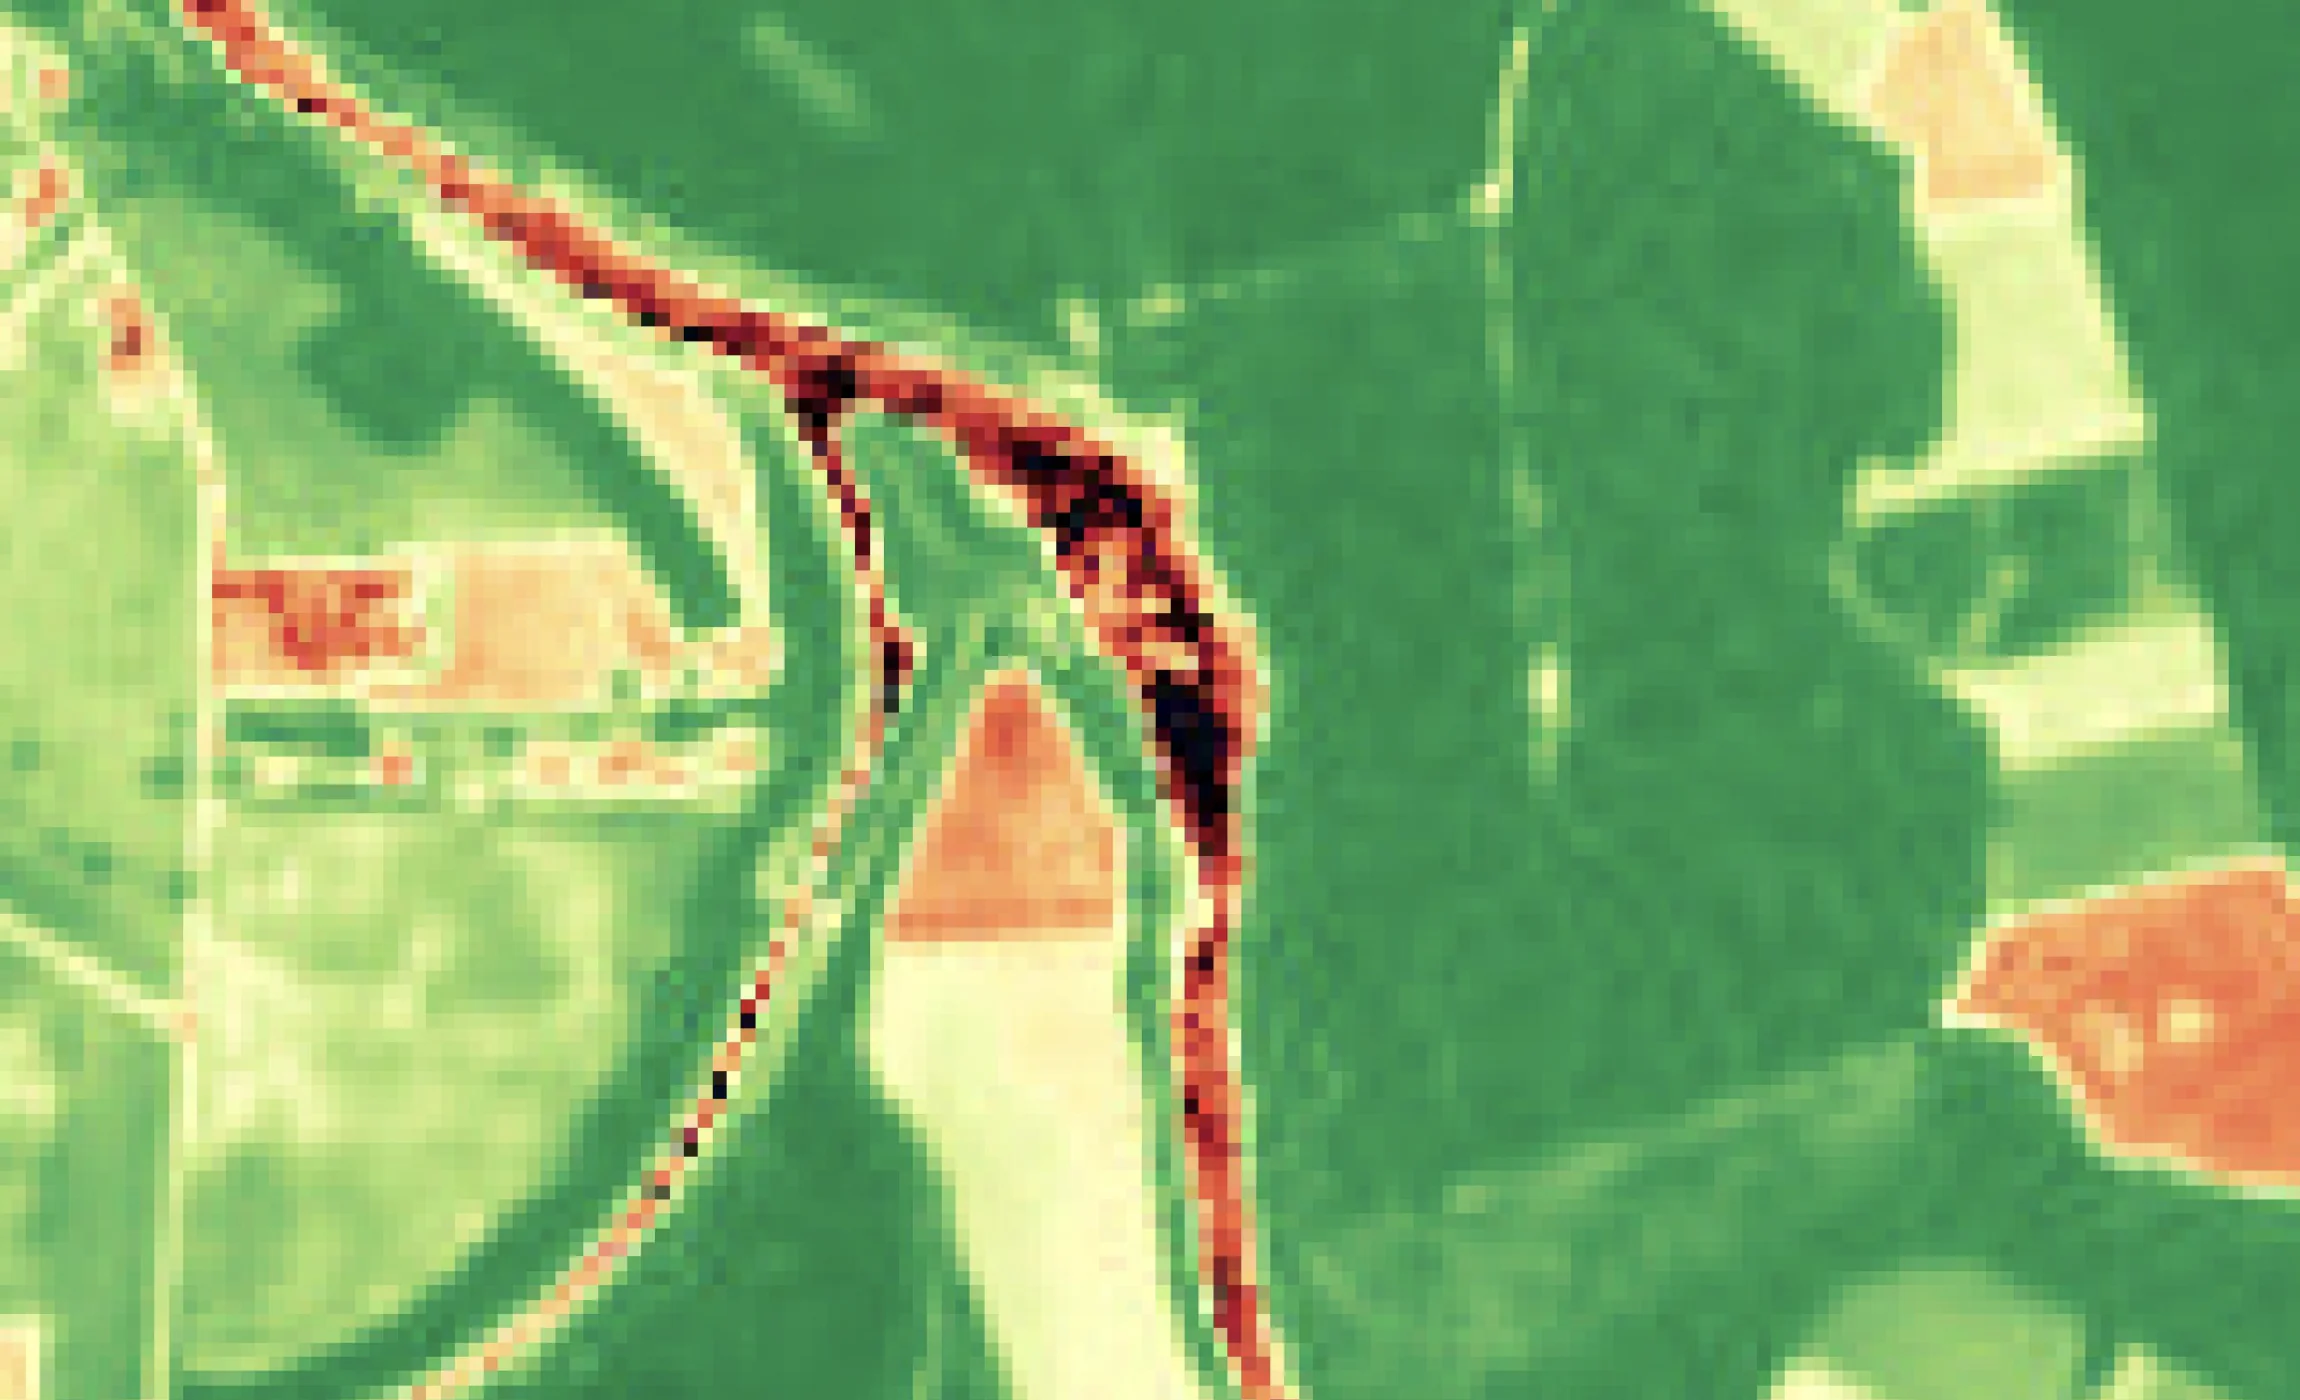
Floodplain woodland at 10 m, and the same scene at 1 m
Sentinel-2 · 10 m
S2DR3 · 1 m
Sentinel-2 vegetation index over a river floodplain of fields and woodland at 10 m, beside the GammaEarth S2DR3 output at 1 m, where field boundaries and the river channel resolve as distinct edges.
Canopy monitoring
Follow degradation, not just clear-cuts
See change smaller than a clear-cut
Selective logging leaves tracks, gaps and thinned stands that average away inside a 10 m pixel. At 1 m, across all 10 spectral bands, that structure separates from intact canopy — forest degradation monitoring, not only deforestation counting.
Check every forest every five days
Sentinel-2 images the whole planet every five days, for free, and each new scene can be super-resolved to 1 m on demand. S2DR4 (Sentinel-2 Deep Resolution 4) adds automated cloud, haze and shadow removal, which keeps the cadence usable over persistently cloudy forest.
See the S2DR3 and S2DR4 modelsAnchor evidence to a 2018 baseline
REDD+ (Reducing Emissions from Deforestation and forest Degradation) reporting stands on MRV — measurement, reporting and verification — and MRV stands on baselines. Any Sentinel-2A or Sentinel-2B scene from 2018 onwards can be super-resolved to 1 m/px, so the baseline exists even where nobody commissioned one.
Cost and access
Forest monitoring does not need a tasked-imagery budget
1 m is sufficient for canopy-scale change
Super-resolved to 1 m/px across all 10 spectral bands — including the red edge, NIR (near infra-red) and SWIR (short-wave infra-red) bands that respond to canopy condition — free Sentinel-2 input is sufficient for selective-logging detection, deforestation alerting, reforestation tracking and post-fire damage mapping.
No tasking queue over remote forest
A remote concession waits for no acquisition window: Sentinel-2 has already imaged it, and does so again every five days. Choose the AOI (area of interest) and the date, and the 1 m product is processed from the existing scene.
Reserve-scale area, credit-scale price
One credit processes one km² of Sentinel-2 imagery in standard regions, at €2.00 per credit from a 100-credit (€200) minimum — a 1,000 km² reserve is 1,000 credits (€2,000) per fully processed date. Orders run through the API or Python SDK, and 20 free scenes through Google Colab let you test over your own forest first.
Dated evidence that can be re-issued
Every output is anchored to a public Sentinel-2 acquisition and its date. Once a date has been processed, retrieving it again is free — the same record can be pulled for an audit years later.
Use cases
From a single stand to a national forest estate
Selective-logging detection
At 1 m, logging tracks, landings and thinned stands resolve as structure rather than dissolving into a mixed pixel — selective logging detection from free Sentinel-2 input.
Deforestation alerting
A new scene of every forest every five days sets the alerting cadence for forest disturbance; canopy change detection then runs at 1 m, placing the loss on the ground rather than somewhere inside a 10 m pixel.
Reforestation and afforestation tracking
Follow planted parcels season by season — canopy closing at 1 m in NDVI (normalised difference vegetation index) and the infra-red bands — against the archive that shows the land before planting.
REDD+ MRV evidence
Anchor measurement, reporting and verification to the 2018 archive: a retrospective baseline for any project area, then a dated 1 m record on a five-day cycle.
See Carbon Projects & MRVPost-fire damage mapping
The NIR and SWIR bands that burn mapping relies on are delivered at 1 m — map the damage against the pre-fire scene the archive already holds.
Land-use and land-cover change
Beyond imagery, GammaEarth delivers land use and land cover (LULC) maps on demand at 10 m or 1 m, with a standard taxonomy — FAO LCCS, ESA WorldCover, CORINE — or one you define.
Explore analytics servicesFAQ
Forest monitoring questions
Can satellite imagery detect selective logging?
Yes — at 1 m. At 10 m, a logging track or a small canopy gap averages into the surrounding forest. GammaEarth turns free Sentinel-2 imagery from 10 m to 1 m resolution across all 10 spectral bands, so that structure resolves — the basis for selective logging and forest degradation detection on free, five-day input.
Is super-resolved Sentinel-2 imagery good enough for forest monitoring?
Yes. At 1 m/px in all 10 spectral bands, logging tracks, canopy gaps and thinned stands resolve as structure — sufficient for selective-logging detection, deforestation alerting and post-fire damage mapping. And because the input is free Sentinel-2, watching a 100 km² reserve costs 100 credits (€200) per fully processed date in standard regions, with a fresh scene available every five days.
How often can forests be monitored for deforestation?
Every forest on Earth is re-imaged every five days by Sentinel-2, free of charge, and each pass can be super-resolved to 1 m on demand. Over persistently cloudy forest, the S2DR4 model (Sentinel-2 Deep Resolution 4) clears cloud, haze and shadow, which keeps the alerting series usable.
What satellite data works for REDD+ MRV?
REDD+ (Reducing Emissions from Deforestation and forest Degradation) reporting requires MRV — measurement, reporting and verification — against a baseline. Any Sentinel-2A or Sentinel-2B scene from 2018 onwards can be super-resolved to 1 m/px, so a project area's baseline can be established retrospectively and every later date measured against the same public sensor.
What does forest monitoring by satellite cost?
Forest areas are billed by the km²: in standard regions one credit, at €2.00, processes one km², from a 100-credit (€200) minimum — so a 1,000 km² concession is 1,000 credits (€2,000) per fully processed date. Re-issuing a date that has already been processed is free, credits last for 24 months, and the 20-scene free tier in Google Colab lets you trial the output first.
Can I get land cover maps as well as imagery?
Yes. GammaEarth delivers land use and land cover (LULC) maps on demand at 10 m or 1 m, using a standard taxonomy — FAO LCCS, ESA WorldCover, CORINE — or one you define, as GeoTIFF or vector with a class legend and metadata. The imagery itself arrives as 16-bit GeoTIFF (COG ready) at 1 m/px in UTM projection.
Monitoring a concession, a reserve, or a national estate?
Tell us the forest areas you need to watch and the cadence your programme requires. We respond within one business day.