Industries
Plot-level deforestation checks, priced for thousands of plots
Corporate sustainability and compliance teams check individual smallholder plots against dated 1 m imagery, priced per km² so an entire sourcing base stays affordable. Behind each check is free Sentinel-2 imagery raised from 10 m to 1 m across all 10 spectral bands, with an archive reaching back to 2018 that brackets the EUDR (EU Deforestation Regulation) cutoff of 31 December 2020 from both sides.
See the difference
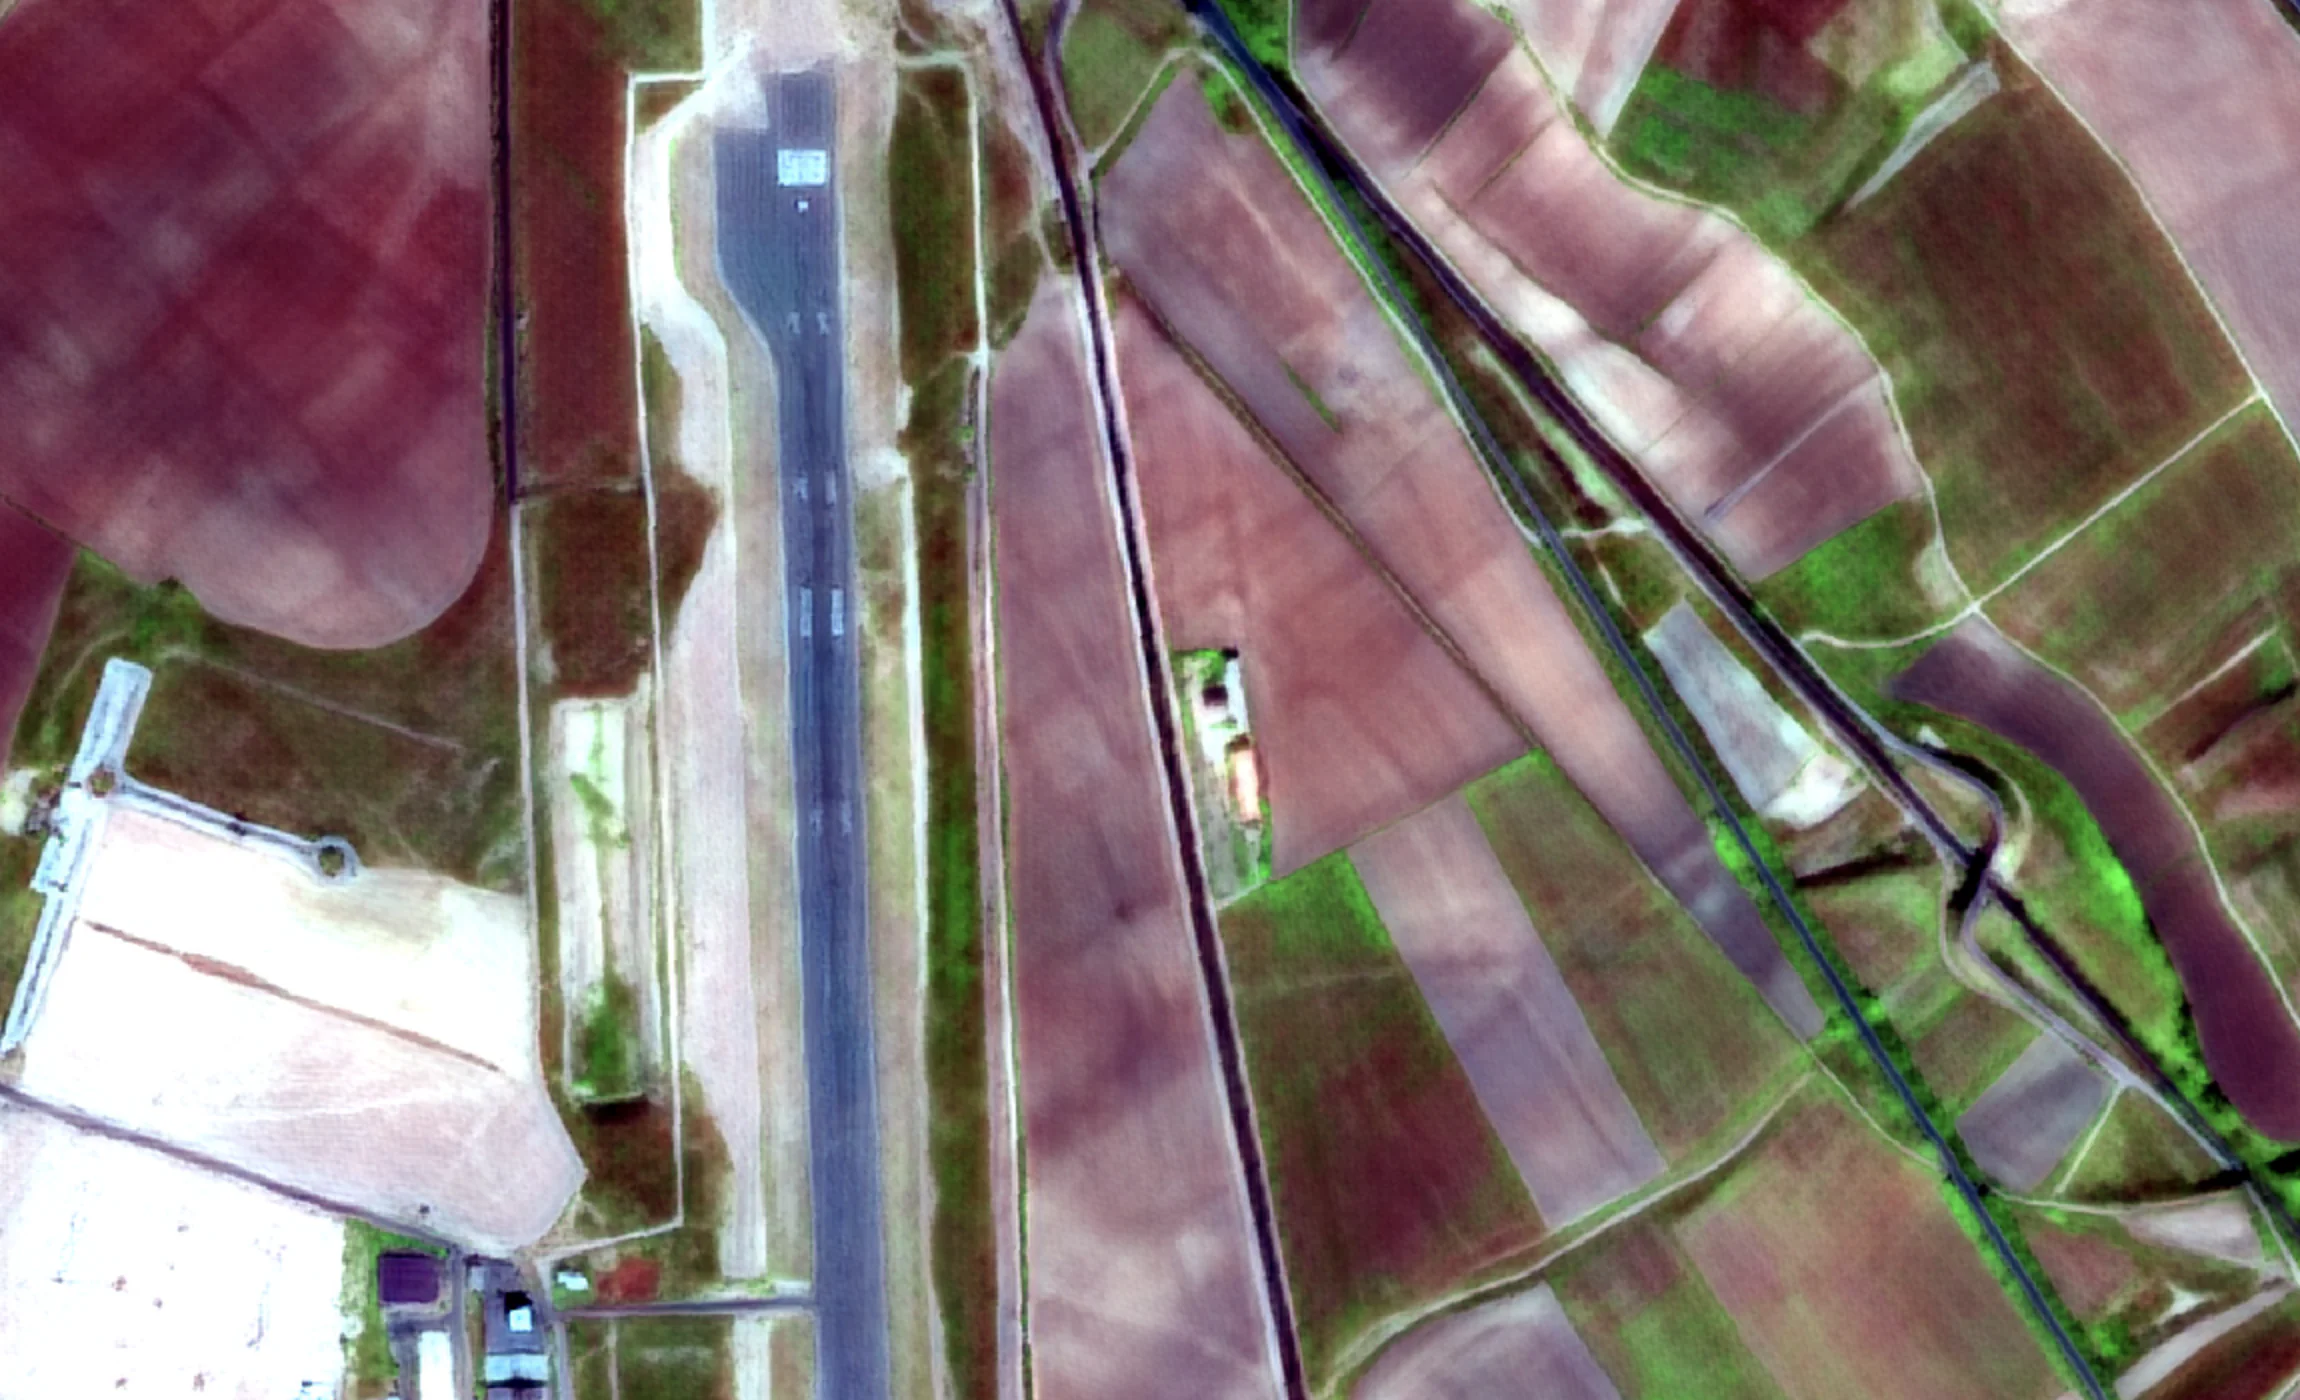
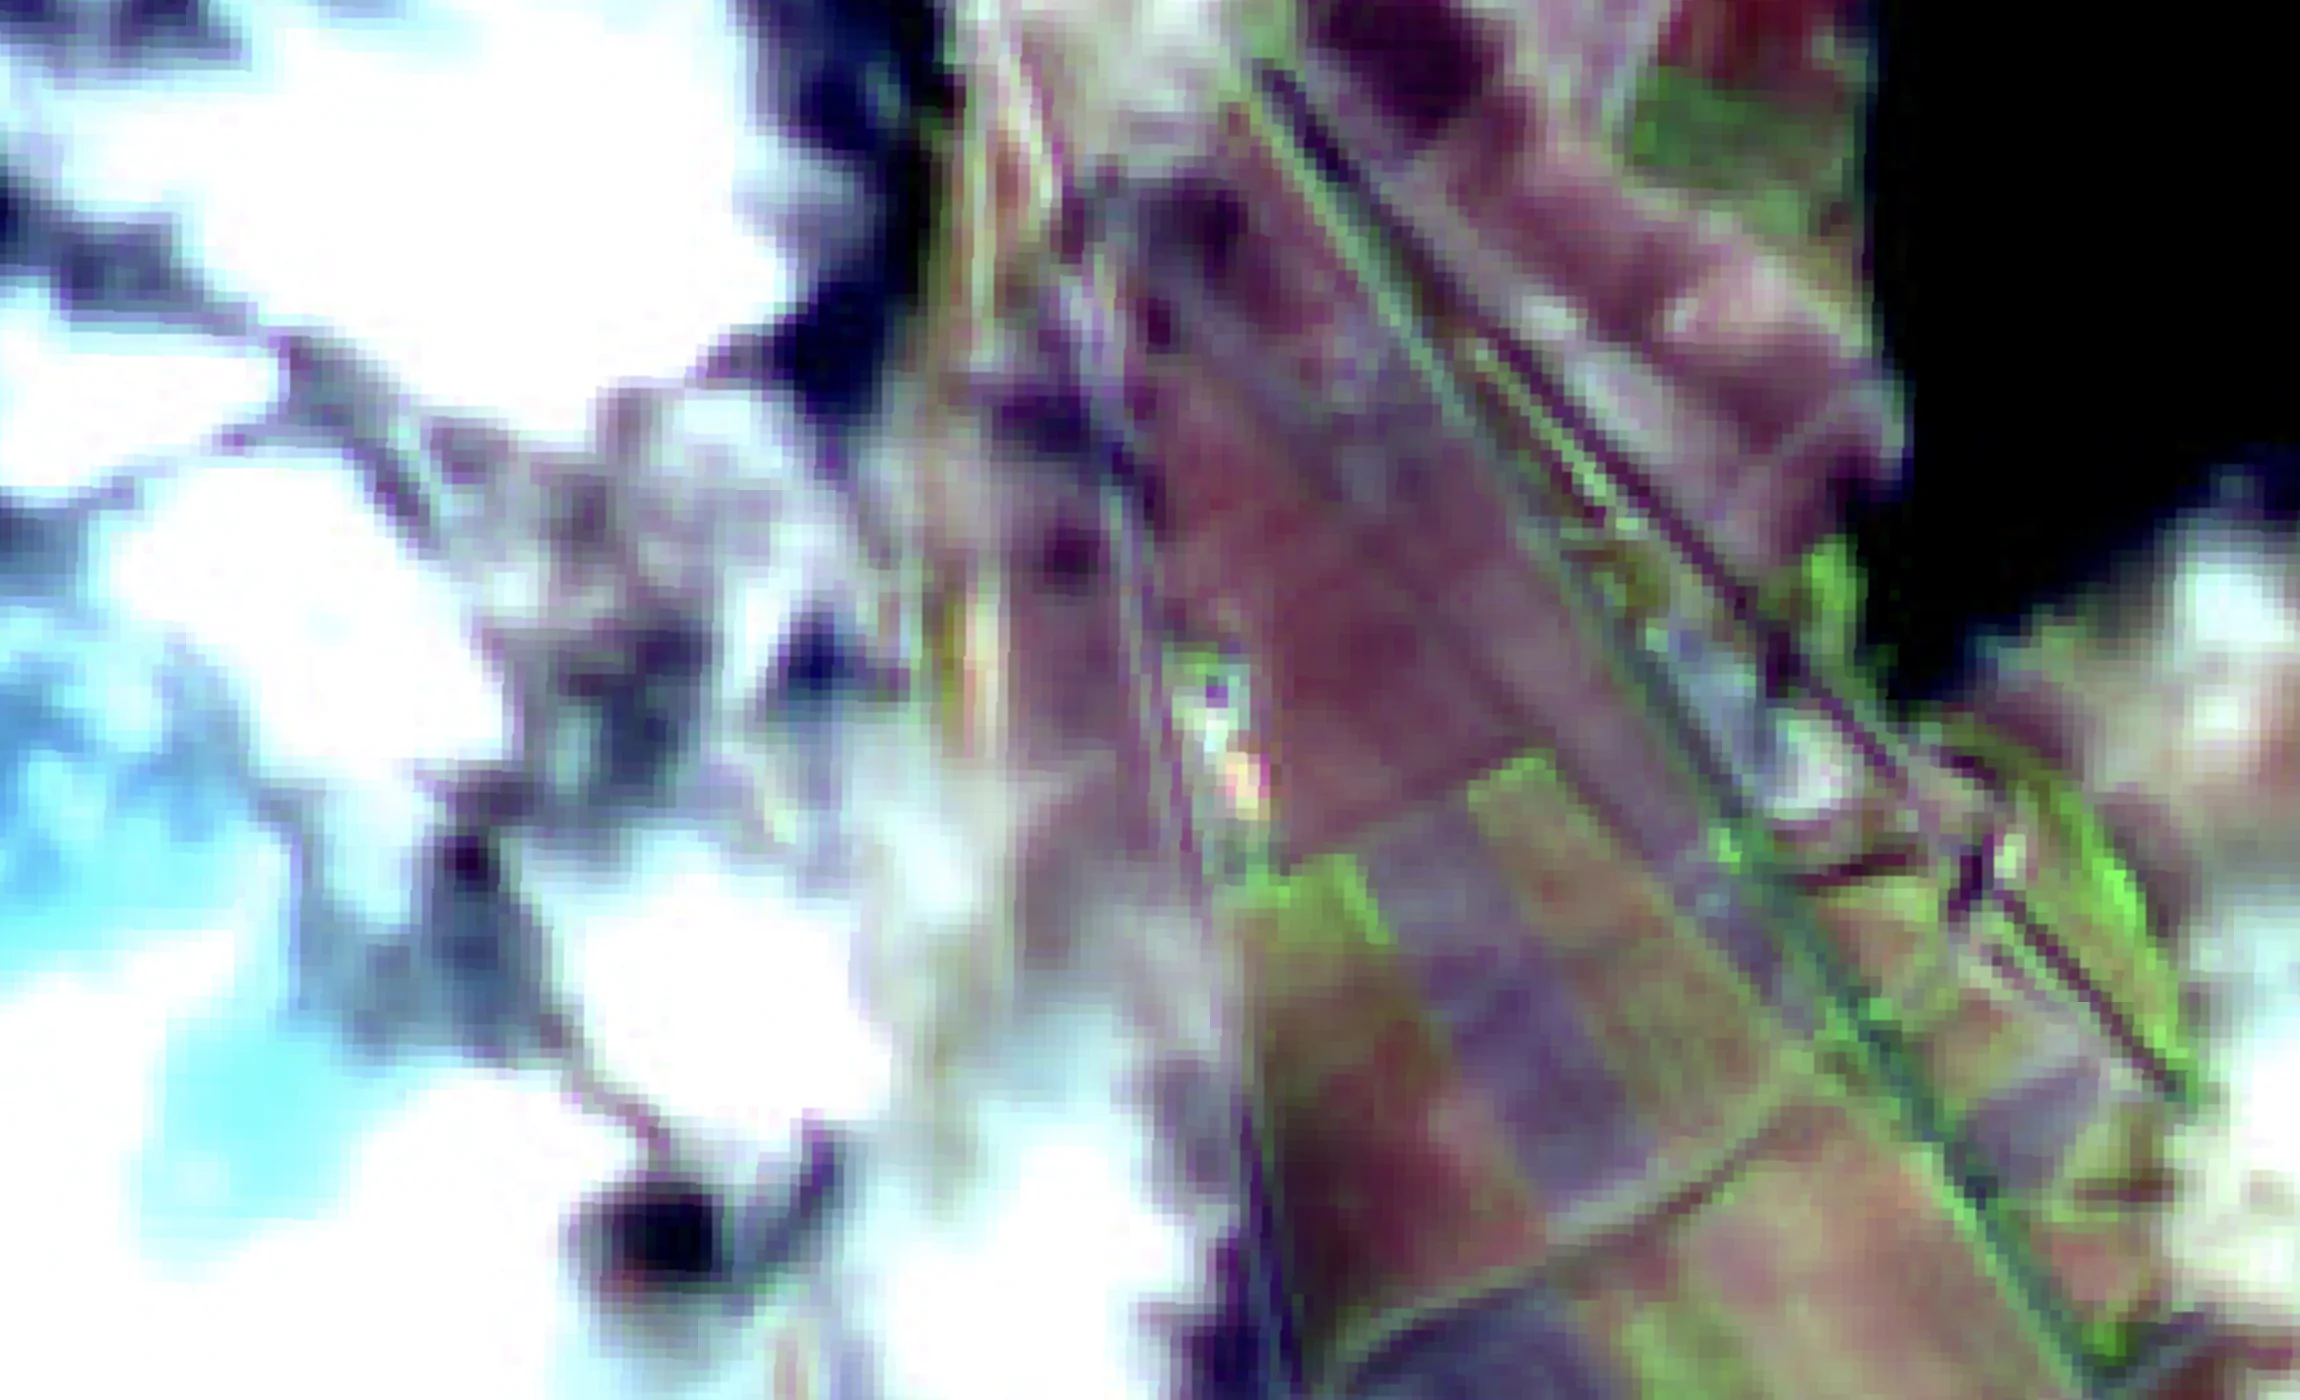
Farmland parcels at 10 m, and the same scene at 1 m
Sentinel-2 · 10 m
S2DR4 · 1 m
Sentinel-2 infra-red pseudo-colour imagery of the airfield and farmland at Teruel at 10 m, beside the GammaEarth S2DR4 output at 1 m, where the runway, the aircraft parked along it and parcel edges resolve.
Regulatory evidence
One archive brackets the 2020 cutoff from both sides
Show the plot before and after the cutoff
EUDR (the EU Deforestation Regulation) requires products to come from land not deforested after 31 December 2020. Any Sentinel-2A or Sentinel-2B scene from 2018 onwards can be super-resolved to 1 m/px, so a plot's state both before and after that date can be documented from the public archive.
Assess plots too small for coarse pixels
Smallholder plots are often a hectare or two, and at 10 m their edges dissolve into mixed pixels. At 1 m the plot has a distinct boundary, a canopy and a history — so a due-diligence assessment rests on what stands on that plot, not on its neighbourhood average.
Run thousands of plots as one pipeline
Due diligence over a sourcing base is a volume problem: thousands of scattered, geolocated plots, each needing dated evidence. Submit plot AOIs (areas of interest) in bulk through the API or Python SDK and receive analysis-ready GeoTIFFs per plot, per date.
Document the check, keep the record
Every output is anchored to a public Sentinel-2 acquisition and its date, and an already-processed date can be retrieved again free — so the evidence behind a due-diligence statement or a CSRD (Corporate Sustainability Reporting Directive) disclosure stays reproducible years later.
Cost and access
Due diligence does not need a tasked-imagery budget
1 m is sufficient for plot-level answers
Super-resolved Sentinel-2 imagery at 1 m/px across all 10 spectral bands is sufficient for checking an individual smallholder plot against the 31 December 2020 cutoff, flagging forest-cover change near supplier plots and grounding CSRD disclosures in dated evidence — for any plot in any sourcing region, from scenes that already exist.
The bill follows area, not plot count
Credits cost €2.00 each from a minimum of 100 credits (€200), and one credit processes one km² of Sentinel-2 imagery in standard regions — the unit is area, so cost scales with the hectares actually checked rather than with the number of separate acquisitions. 20 free scenes through Google Colab let a compliance team test on real supplier plots first.
See pricingThe record predates the question
A compliance question usually arrives about the past: was this plot forested at the end of 2020? A tasked acquisition cannot answer it. The Sentinel-2 archive can — any scene from 2018 onwards can be super-resolved to 1 m/px, on demand.
Ten bands of canopy evidence, not a snapshot
Deliverables are the full 10-band multispectral product at 1 m/px — the red edge, NIR (near infra-red) and SWIR (short-wave infra-red) bands respond to canopy and vegetation condition — plus derived RGB, NDVI (normalised difference vegetation index) and IRP (infra-red pseudo-colour) composites, as 16-bit GeoTIFF (COG ready).
Use cases
From one plot to a whole supply chain
EUDR plot-level due diligence
Check each geolocated plot in a due-diligence statement against dated 1 m imagery from both sides of the 31 December 2020 cutoff — evidence for the assessment, plot by plot.
Supplier sourcing-area monitoring
Monitor whole sourcing regions on a five-day cycle and flag where forest cover changes inside or near supplier plots — evidence for deforestation-free sourcing claims, and the watchlist that decides where scrutiny goes next.
CSRD and ESG disclosure evidence
Ground ESG (environmental, social and governance) disclosures in dated imagery: land-use figures and change assessments traceable to public Sentinel-2 acquisitions rather than to supplier questionnaires.
Before-and-after report documentation
Pair any two dates since 2018 into a before-and-after record at 1 m for sustainability reports and stakeholder communications — same source, same processing, any site.
Water and land-degradation monitoring
Track surface water, moisture stress and expanding bare ground around operations and concessions on a five-day series — the SWIR bands respond to water in soil and canopy, delivered at 1 m.
Land and net-zero commitment verification
Corporate planting and restoration pledges happen on real parcels. Verify them at 1 m — canopy establishing against the pre-project archive. Running a carbon project rather than reporting for a corporation?
See Carbon Projects & MRVFAQ
Compliance monitoring questions
How can satellite imagery support EUDR compliance?
EUDR (the EU Deforestation Regulation) requires due diligence showing that products come from land not deforested after 31 December 2020. GammaEarth turns free Sentinel-2 imagery from 10 m to 1 m resolution across all 10 spectral bands, so each geolocated plot can be checked against dated imagery from before and after the cutoff. The output is evidence for a due-diligence assessment, not a legal determination of compliance.
Can satellite imagery show whether land was deforested after 2020?
Yes. Any Sentinel-2A or Sentinel-2B scene from 2018 onwards can be super-resolved to 1 m/px, so the archive brackets 31 December 2020 from both sides: a plot's state before that date and its state after it can both be documented from the same public sensor.
Which commodities does EUDR cover?
EUDR (the EU Deforestation Regulation) covers cattle, cocoa, coffee, oil palm, rubber, soya and wood, together with products derived from them. For each, due diligence must show the product comes from land not deforested after 31 December 2020 — a check GammaEarth supports with dated 1 m imagery from both sides of that cutoff. The output is evidence for a due-diligence assessment, not a legal determination of compliance.
Is super-resolved Sentinel-2 imagery good enough for EUDR checks?
Yes. A smallholder plot that dissolves into mixed pixels at 10 m has a distinct boundary, canopy and history at 1 m/px — sufficient for checking geolocated plots against the 31 December 2020 cutoff and flagging forest-cover change near suppliers. Cost follows the area actually checked, at €2.00 per km² in standard regions, so scrutiny can extend across a sourcing base rather than stopping at a sample. The result is evidence for a due-diligence assessment, not a legal determination of compliance.
How do you monitor thousands of supplier plots efficiently?
Through the API or Python SDK: submit plot AOIs (areas of interest) in bulk, and each returns dated, analysis-ready 16-bit GeoTIFF (COG ready) at 1 m/px. Pricing is per km² — €2.00 per credit, one credit per km² in standard regions — so cost scales with the area actually checked.
What satellite evidence works for CSRD and ESG reporting?
CSRD (the Corporate Sustainability Reporting Directive) and wider ESG (environmental, social and governance) disclosures need verifiable underlying evidence. GammaEarth output is anchored to public Sentinel-2 acquisitions with known dates, delivered as 16-bit GeoTIFF (COG ready) at 1 m/px — records an auditor can trace back to the open source scene.
What does plot-level deforestation monitoring cost?
The unit is area: €2.00 per credit, one credit for every km² processed in standard regions, from a minimum of 100 credits (€200). Each newly processed date is charged; a previously processed date can be pulled again without charge, and a credit balance stays usable for 24 months. If you are developing a carbon project rather than reporting on a supply chain, the Carbon Projects & MRV page covers that workflow.
Preparing due diligence across a supplier base?
Tell us the plots you need to check and the reporting cycle they feed. We respond within one business day.