Industries
Every field at 1 m, every five days, back to 2018
Farmers and agronomy teams get crop monitoring at sub-field detail: GammaEarth takes free Sentinel-2 imagery from 10 m to 1 m across all 10 spectral bands, with no flight or tasking to commission. A fresh scene of every farm arrives every five days, and the record of past growing seasons reaches back to 2018.
See the difference
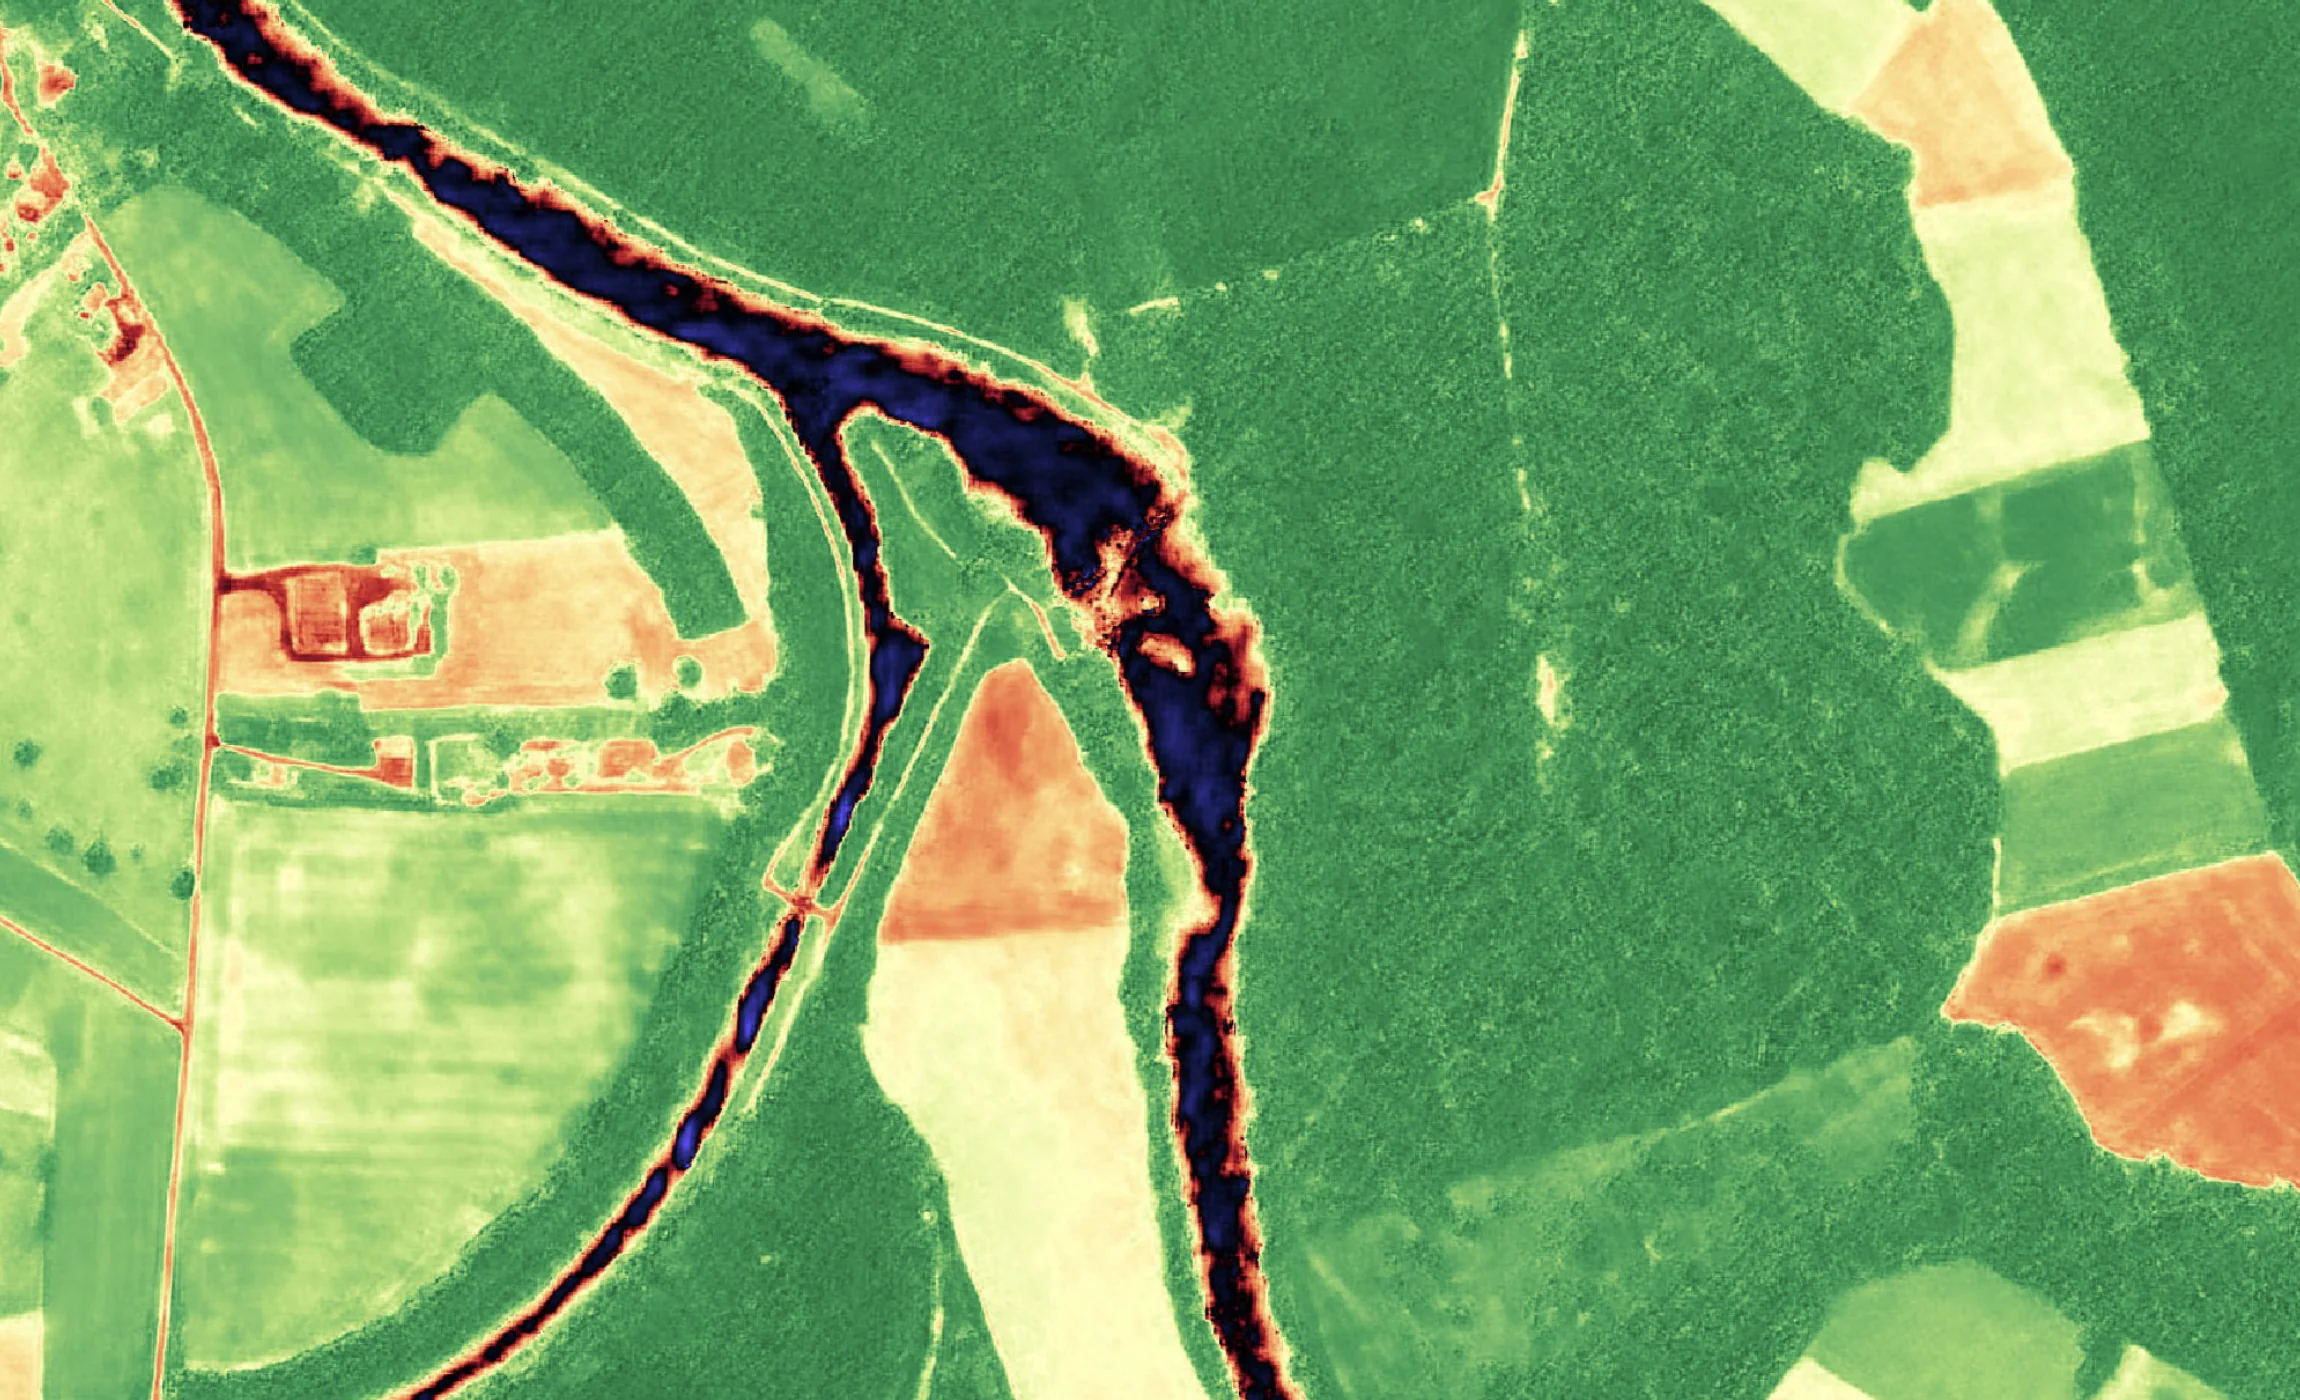
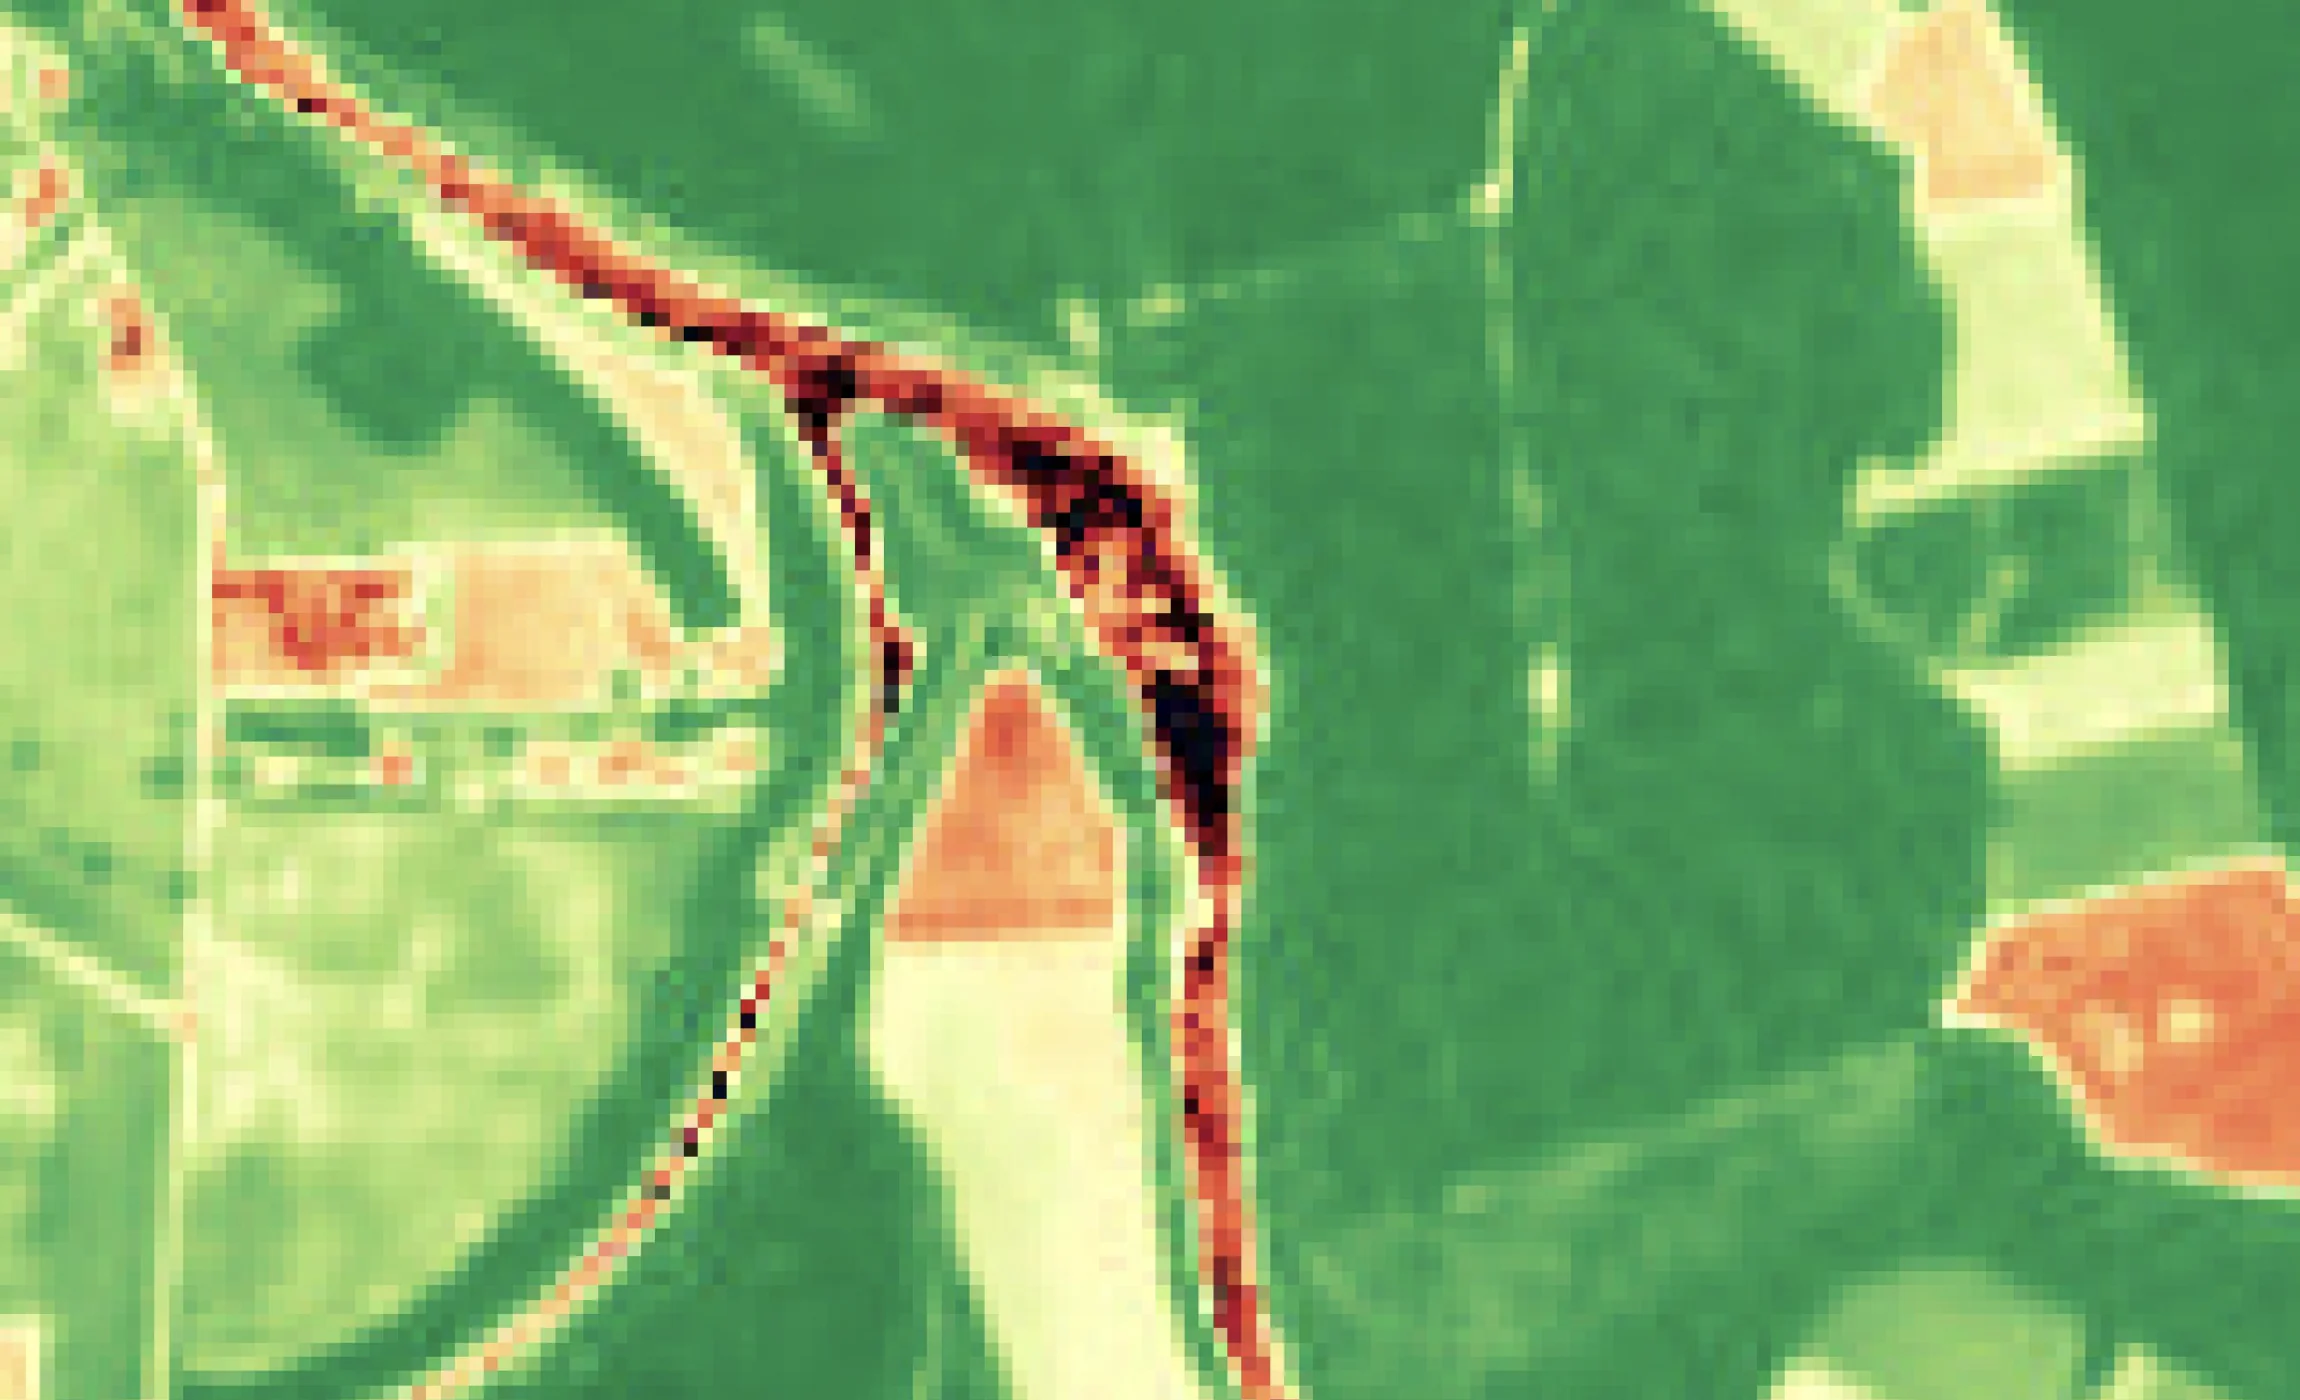
Farmland at 10 m, and the same scene at 1 m
Sentinel-2 · 10 m
S2DR3 · 1 m
Sentinel-2 vegetation index over a river floodplain of fields and woodland at 10 m, beside the GammaEarth S2DR3 output at 1 m, where field boundaries and the river channel resolve as distinct edges.
In-season monitoring
See variation within the field, not just between fields
Find stress while it is still local
NDVI (normalised difference vegetation index) at 1 m places stress within a field — a headland, a low corner, a struggling block — rather than averaging it into a 10 m pixel. A new scene arrives every five days, in time to scout and act.
Read water status in the infra-red
Sentinel-2's SWIR (short-wave infra-red) bands respond to moisture in soil and canopy, and its red edge and NIR (near infra-red) bands to crop vigour. GammaEarth delivers all of them at 1 m — high-resolution NDVI imagery is one derived product of ten bands, not the whole output.
Draw management zones from seasons of evidence
Zones built from a single image reflect one week's weather. The archive holds every growing season since 2018, so management zones can be delineated from the pattern that repeats across years — per field, per parcel.
Run the whole season through one API
Order the same field AOIs (areas of interest) on a fixed cadence through the satellite imagery API or Python SDK, and each date arrives as analysis-ready GeoTIFFs — precision agriculture data as a feed, not a procurement exercise.
Cost and access
A season of crop monitoring does not need an imagery budget
1 m is sufficient for the season's decisions
S2DR3 and S2DR4 (Sentinel-2 Deep Resolution 3 and 4) rebuild free Sentinel-2 imagery at 1 m/px in all 10 spectral bands — sufficient for in-season stress scouting, management-zone delineation, irrigation monitoring and field-boundary mapping, without commissioning an acquisition or a flight.
See the S2DR3 and S2DR4 modelsPriced for a single holding
Credits cost €2.00 each from a minimum of 100 credits (€200), and one credit processes one km² of Sentinel-2 imagery in standard regions — a 50 km² holding is 50 credits (€100) per processed date.
See pricingThe archive was recording before you asked
A commissioned acquisition exists only from the day someone ordered it. Any Sentinel-2A or Sentinel-2B scene from 2018 onwards can be super-resolved to 1 m/px — a historical crop imagery archive for every parcel, charged per processed date and free to retrieve again.
Test it on your own fields, free
20 free scenes through Google Colab run in the browser, with nothing to install — see what 1 m makes of fields you know before buying credits. The same product then arrives through the satellite imagery API or Python SDK, season after season.
Use cases
From a single field to a whole region
Management-zone delineation
Delineate zones from the multi-season archive: at 1 m, the pattern that repeats across years separates soil-driven variation from one season's weather.
Automated field-boundary delineation
Field boundary detection needs edges, and at 1 m a boundary is an edge rather than a mixed pixel — machine-readable input for parcel mapping across whole regions.
In-season crop-stress scouting
A fresh 1 m scene every five days shows where NDVI departs from the field's norm — direct the agronomist to the spot instead of walking the whole block.
Irrigation and soil-moisture monitoring
The SWIR bands respond to water in soil and canopy. At 1 m they resolve moisture patterns within a pivot or an irrigation block, not just its average.
Historical yield-pattern analysis
Super-resolve past seasons back to 2018 for any parcel and compare them: the parts of a field that underperform every year are visible before the next one is planted.
Parcel verification and compliance
Check declared crops, areas and land use against dated 1 m imagery — the same objective record, parcel after parcel, for subsidy and compliance workflows.
FAQ
Crop monitoring questions
Can free satellite imagery show detail within a single field?
Yes. GammaEarth turns free Sentinel-2 imagery from 10 m to 1 m resolution across all 10 spectral bands — Sentinel-2 super-resolution sharp enough to show variation within a field rather than one averaged value per 10 m pixel. High-resolution NDVI (normalised difference vegetation index) is derived from the same scene.
Is super-resolved Sentinel-2 imagery good enough for crop monitoring?
Yes. At 1 m/px, with the red edge, NIR (near infra-red) and SWIR (short-wave infra-red) bands preserved, the output supports in-season stress scouting, management-zone delineation and irrigation monitoring at sub-field scale. The price follows field economics: one credit covers one km² in standard regions at €2.00, so ten processed dates over a 5 km² farm — a season of monitoring — is 50 credits (€100).
What is the highest resolution NDVI available from satellite imagery?
NDVI (normalised difference vegetation index) is computed from the red and near infra-red bands, so its resolution follows the imagery it is derived from. GammaEarth super-resolves free Sentinel-2 imagery from 10 m to 1 m across all 10 spectral bands and delivers NDVI as a derived composite of that product — high-resolution NDVI at 1 m/px, from the same scene as the multispectral output.
How often is new satellite imagery of my fields available?
A fresh scene of every field arrives every five days — Sentinel-2's free global revisit — and any of them can be super-resolved to 1 m on demand. Through cloudy spells, S2DR4 (Sentinel-2 Deep Resolution 4) strips out cloud, haze and shadow so fewer acquisitions in a season are lost.
Is there historical satellite imagery of past growing seasons?
Yes. Any Sentinel-2A or Sentinel-2B scene from 2018 onwards can be super-resolved to 1 m/px — a historical crop imagery archive covering every parcel. It supports management-zone delineation, yield-pattern analysis and baselines, without the imagery having been planned at the time.
What does satellite crop monitoring cost?
Crop monitoring is billed per km² and per date: €2.00 buys one credit, one credit processes one km² in standard regions, and the entry point is 100 credits (€200) — a 50 km² holding is 50 credits (€100) per processed date. A date already processed can be retrieved again at no charge, credits are valid for 24 months, and 20 free scenes in Google Colab let you test on your own fields first.
What data do I receive for agricultural analysis?
The full 10-band multispectral product at 1 m/px ground sample distance (GSD), in UTM projection, as 16-bit GeoTIFF (COG ready — cloud-optimised GeoTIFF), with derived 3-band RGB, NDVI and IRP (infra-red pseudo-colour) composites — delivered through the API or Python SDK as direct input for vegetation indices, zoning algorithms and crop models.
Monitoring one farm or a whole region?
Tell us the parcels you follow and the cadence your season needs. We respond within one business day.